See where you're off target and what to fix first
SM-GPD is a strategy deployment dashboard. It puts targets, actuals and ranked gaps on one screen, scoped to each role, with approval and countermeasures built in.
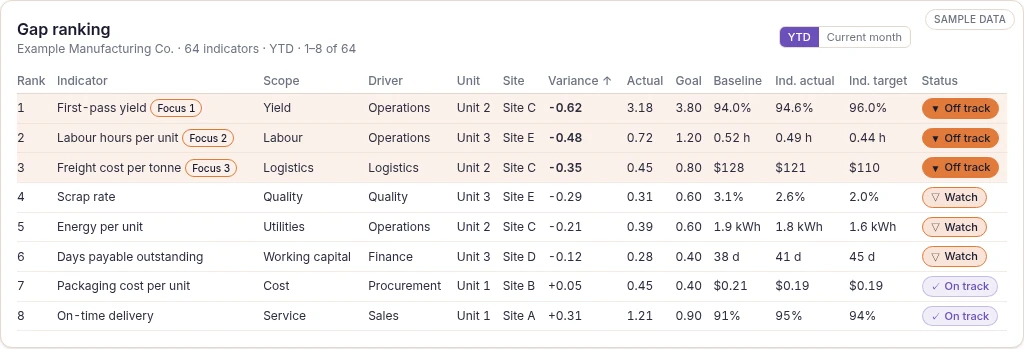
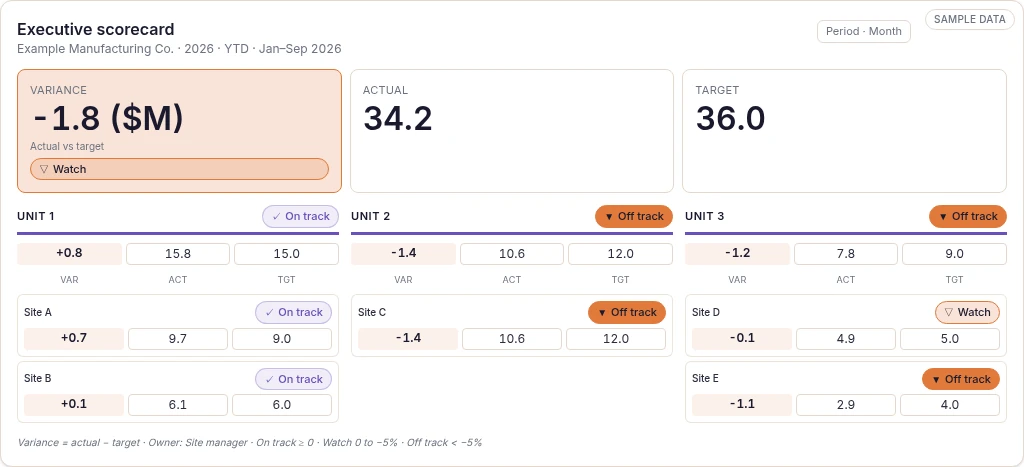 Sample data
The problem
The plan, the result and the action live in different places.
The plan lives in a dozen spreadsheets
Targets, actuals and explanations sit in different files.
Meetings reconcile instead of decide
Three versions of the same number turn the review into a reconciliation exercise.
Focus arrives late
The biggest gaps only show up after someone builds the Pareto chart.
Ownership is blurred
Nobody is sure who defines, enters, approves or acts on a number.
How it works
Five steps a month. The orange ones belong to a person.
- Set the structureThe hierarchy and an indicator catalogue, each indicator with an owner.
- Enter results in scopeA personEach owner enters their month, and only their scope.
- ApproveA personA manager reviews the variance and approves the number or sends it back.
- Rank the gapsThe system turns each gap into financial impact and ranks it.
- Act and close the loopA personCountermeasures get owners, and the result feeds next month.
The system does
- consolidates results
- calculates variance
- turns gaps into financial impact
- ranks the gaps
- routes approvals and notifies owners
- builds the monthly pack
A person decides
- the targets
- what each indicator means
- whether a number is approved
- which countermeasure to run
Every number keeps its owner, its approver and its history.
Inside the screens
Screens from the product, filled with sample data.
 Sample data
Three roles, one set of numbers
Executive leadership
One view of the whole plan.
Opens the monthly review from the scorecard.
Site and unit managers
An approval queue and a ranked gap list for their scope.
Approves the month and assigns countermeasures.
Performance and improvement leads
One catalogue, with one definition per indicator.
Keeps the targets current and chases overdue actions.
What it doesn't do
It measures, ranks and routes. Every number can be explained, because there is no model inside.
- It has no machine learning and makes no forecasts.
- It sits on top of your BI or data warehouse and runs the management cycle on numbers you have already agreed.
- It leaves countermeasures to owners and managers.
- It has no automatic ERP feed today. Data arrives through controlled monthly entry.
- It does not set your targets. It deploys and tracks the ones leadership agrees.
An agreed indicator catalogue with owners, an organisational hierarchy, monthly targets per indicator and a named approver for each scope.
Running your strategy review from spreadsheets?
Let's look at your indicator tree together and see whether SM-GPD fits the way you review the month.